

Table of Contents
- Why Maintenance Supply Costs Get Lost in the Shuffle
- What to Track: Labor, Parts, Materials, and Overhead
- How to Calculate Total Maintenance Costs Step by Step
- Using a Maintenance Inventory Spreadsheet Template for Supply Tracking
- Recording Parts Usage and Inventory Valuation
- Maintenance Cost per Work Order: Formula and Benchmarks
- When Maintenance Management Software Is Worth It
- Maintenance Supply Cost Reduction Without Cutting Corners
- Frequently Asked Questions
Last Updated: October 12, 2026
Why Maintenance Supply Costs Get Lost in the Shuffle
The best way to track maintenance supply costs is to record every part as it leaves the shelf, tie it to a work order, and price it the same day.
A technician grabs a faucet cartridge, a supply line, and sealant. Nothing gets logged, and three weeks later the budget shows a gap nobody can explain.
Supplies vanish from your records for four predictable reasons:
- Parts get pulled without a work order number
- Invoices get filed by accounting, not by asset
- Bulk purchases land in one month but get used over six
Fix those leaks and your numbers start telling the truth.
What to Track: Labor, Parts, Materials, and Overhead
Total maintenance cost has four buckets, and mixing them leads to bad decisions. Keep labor, parts, materials, and overhead separate.
Labor is wages plus benefits for hours worked. Parts are replaceable components: cartridges, flanges, valves, supply lines. Materials are consumables: sealant, tape, caulk, cleaning supplies. Overhead covers fixed costs like truck fuel and software fees. Track hours and rates separately from parts to see whether a repair is expensive because of time or components.
Separating Supply Costs from Labor and Overhead
Supply costs should never share a line item with labor, or you cannot tell whether a repair was slow or simply used pricey parts. Give every expense one home.
- Labor hours go to the work order's labor field
- Parts go to the work order's parts field
- Consumables go to a materials line
This matters most when comparing properties: two buildings can post the same total spend for very different reasons.
How to Calculate Total Maintenance Costs Step by Step
Total maintenance cost equals labor plus parts plus materials plus allocated overhead. Run it per work order, then roll it up by asset, building, and month:
- Pull every work order for the period.
- Add labor hours multiplied by the loaded hourly rate.
- Add the cost of all parts used.
- Add consumables and materials.
- Allocate a share of overhead to each work order.
- Total the columns and compare against your maintenance budget.
The allocation step trips people up. A common approach spreads overhead by labor hours, so a job taking twice as long carries twice the overhead. It is not perfect, but consistency makes trends readable.
Using a Maintenance Inventory Spreadsheet Template for Supply Tracking
A maintenance inventory spreadsheet template works well for most property teams up to a few thousand units. It costs nothing and forces you to define your own categories.
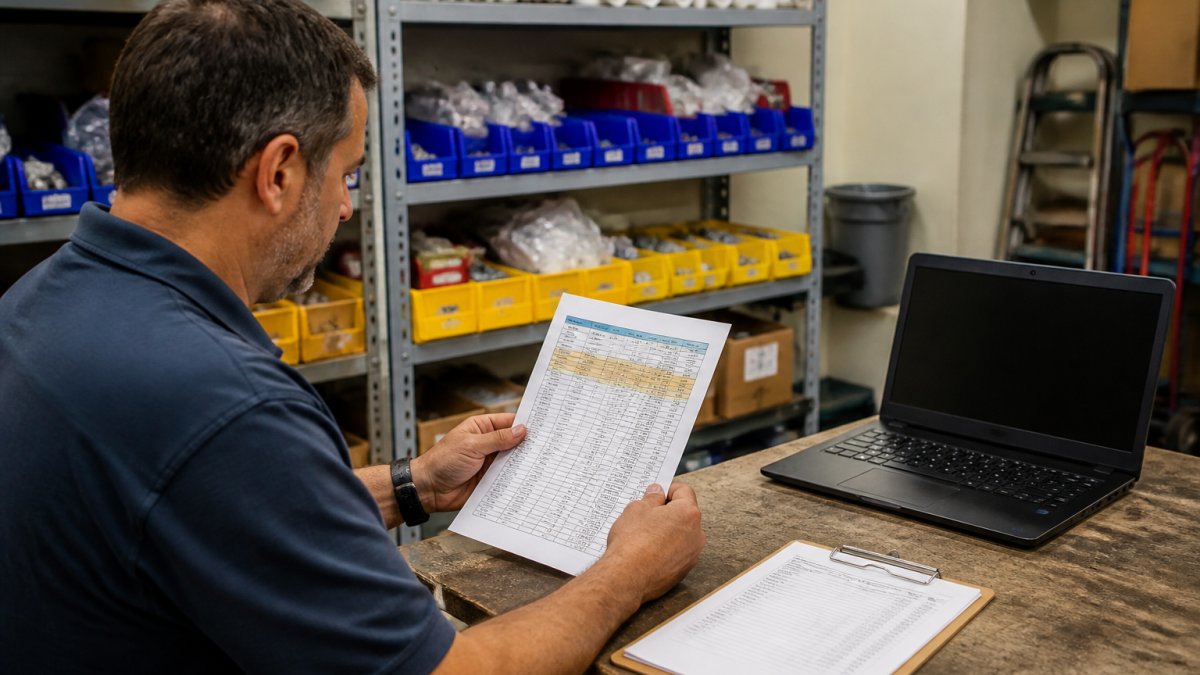
Build your template with these tabs:
- Parts list: part number, description, unit cost, supplier, reorder point
- Usage log: date, work order number, part, quantity, unit cost
- Purchase log: purchase order number, invoice date, quantity, total
The usage log is the engine. Everything else feeds it.
Example: Calculating Cost per Work Order in a Spreadsheet
Say a technician replaces a shower valve cartridge, handle trim, and a supply line in one hour.
| Line item | Quantity | Unit cost | Total |
|---|---|---|---|
| Labor (1 hour) | 1 | rate per hour | rate per hour |
| Cartridge | 1 | part cost | part cost |
| Handle trim | 1 | part cost | part cost |
| Supply line | 1 | part cost | part cost |
| Sealant | 1 | material cost | material cost |
| Allocated overhead | 1 | share | share |
Add the column and you have your cost per work order. Do this for fifty jobs and patterns appear fast: one unit type keeps eating cartridges, another keeps needing full valve swaps. For current parts pricing, check the supplier's site rather than guessing.
Recording Parts Usage and Inventory Valuation
Parts usage is only useful if it connects to a value. Every time a part leaves the shelf, record the quantity and apply a cost method. That sounds simple until freight, taxes, bulk buys, returns, and shared stock distort supply-cost tracking, the cases most guides skip.
What Belongs in the Unit Cost
A part's true cost is not just the invoice line. Build a landed unit cost that includes:
- Purchase price, the base cost from the supplier
- Freight and shipping, allocate across the shipment, not to a single part
- Sales tax, capitalize it into the unit cost unless your accounting setup treats it separately (Topic no. 703, Basis of assets)
A common pattern is to divide total freight by line items or extended cost, then add that share to each part's unit cost. Pick one allocation basis and use it every time; switching mid-year makes trends unreadable.
Costing Methods: Weighted Average vs. FIFO
Two methods dominate in practice:
- Weighted average: blend all purchase prices for a part into one running cost. Simple, stable, and the right default for most property operations.
- FIFO (first in, first out): assume the oldest stock gets used first. Tighter accuracy when part prices swing, but more bookkeeping.
Whichever you pick, apply it the same way every time; switching mid-year makes cost trends meaningless.
Handling the Awkward Cases
These transactions break naive trackers:
- Bulk purchases: a case of 50 cartridges bought in March but used through August should not hit March's budget. Record the purchase as inventory, then expense each part as it is issued.
- Returns and credits: reverse the original unit cost, not the current one, so the credit matches what you paid.
- Shared stock: if one shelf serves three buildings, issue parts to a specific work order or location at the moment of pull. Do not leave them in a central pool.
Allocating Supply Costs to Assets, Work Orders, and Locations
Every issued part needs one home. Use this rule set:
| Cost type | Where it lands |
|---|---|
| Part tied to a work order | Work order's parts field |
| Consumable used on a job | Work order's materials line |
| Stock purchased but not yet used | Inventory asset account |
| Part issued to a location without a work order | Location's supply cost pool |
This makes asset-level and property-level reporting possible. Without it, you can total spending but cannot answer "what did this unit cost us last year?"
A Worked Example
Buy 20 supply lines at $6 each, plus $20 freight and $9 tax. Total landed cost is $149, or about $7.45 per line. A technician uses two on a work order, so that work order carries $14.90 in parts cost, not $12. Across hundreds of work orders, that gap becomes a real number in your budget.
Maintenance Cost per Work Order: Formula and Benchmarks
Maintenance cost per work order equals total maintenance spending divided by completed work orders in the same period, the cleanest number for comparing properties, teams, and months.
The formula:
Cost per work order = (Labor + Parts + Materials + Overhead) ÷ Work orders completed
Track it monthly. Watch the trend rather than the absolute figure, because a property with older fixtures will always run higher than a newly renovated one.
Supply-Specific KPIs Worth Tracking
Cost per work order is a starting point, not the whole picture. To manage supply spending, add these measures:
- Supply cost per work order, parts plus materials divided by completed work orders. Isolates the supply portion from labor.
- Supply cost per asset, total supply spend for a unit divided by its operating period. Surfaces the units that keep eating cartridges.
- Supply cost as a share of total maintenance spend, a rising share often means labor is being under-recorded, not that parts got expensive.
How to Read the Numbers
A few rules keep you from chasing noise:
- Compare like properties. A building with original fixtures will outspend a renovated one on supplies no matter how well it is managed.
- Watch the trend, not the month. One large bulk purchase can spike a single month without meaning anything.
- Pair cost with reliability. A cheap part that fails twice costs more than the OEM-grade version that lasts.
Reorder Controls and Stock Accuracy
KPIs are only actionable if stock records are accurate. Pair the metrics above with basic controls:
- Minimum and maximum levels, set a floor that prevents stockouts and a ceiling that prevents dead stock.
- Reorder point, a common rule is two weeks of average usage, adjusted up for long lead times.
- Cycle counts, count high-use parts monthly, not annually. Annual counts leave inventory value wrong for most of the year.
A Simple Benchmarking Habit
You do not need industry averages to benchmark well. Compare each property against its own prior period and against similar properties in your portfolio. A property whose supply cost per work order climbs while work order volume stays flat has a supply-control problem, not a demand problem. That is the signal worth acting on.
When Maintenance Management Software Is Worth It
Maintenance management software earns its cost when spreadsheets start breaking, usually with multiple properties, multiple technicians, and inventory that no longer fits one file. A CMMS handles work orders, parts usage, purchase orders, invoices, and asset history in one place, giving you one record per asset instead of three spreadsheets and a filing cabinet.
Signs it is time to switch:
- You cannot answer "what did this unit cost us last year?" in under five minutes
- Parts stockouts keep delaying repairs
- Two people maintain competing versions of the same list
Below that threshold, a clean spreadsheet does the job. Above it, software pays for itself in recovered labor hours.
Maintenance Supply Cost Reduction Without Cutting Corners
Maintenance supply cost reduction comes from control, not from buying the cheapest part. Cheap parts fail early, and the callback costs more than the savings.
What actually works:
- Standardize on OEM-grade components so repairs behave predictably
- Consolidate orders to cut freight and admin time
- Set reorder points so you never pay rush pricing
The goal is fewer trips, fewer callbacks, and fewer emergency purchases. Those three things drive most of the waste in bathroom maintenance.
Standardized Kits and Reorder Controls That Prevent Stockouts
Standardized repair kits remove the biggest hidden cost: the store run. A technician who leaves the property to buy a cartridge burns an hour of labor and a vehicle trip. Pre-kitted bathroom repair sets solve this by putting every part for a common job in one box, with OEM-grade components from brands like Moen, Delta, and BrassCraft.
Pair kits with reorder controls:
- Set a reorder point at two weeks of average usage
- Count high-use parts monthly, not annually
- Flag any part that triggers more than one stockout per quarter
Do that, and your maintenance spending stops surprising you.
Frequently Asked Questions
What is the best way to track maintenance supply costs?
The most reliable method combines work orders, a spreadsheet or CMMS, and inventory controls. Record every part and material on the work order, assign a unit cost, and update stock levels immediately after use. This gives you a true cost per work order and per asset. A maintenance inventory spreadsheet template works well for smaller teams, while maintenance management software automates the process as you scale across multiple properties.
What should a maintenance supply cost tracker include?
A complete tracker should list part numbers, descriptions, unit costs, quantities used, work order numbers, asset IDs, dates, and vendor or purchase order references. Add columns for labor hours and labor rates if you want a full cost per work order. Include reorder points and current stock levels so you can flag items before they run out. This structure supports cost allocation, inventory valuation, and trend analysis without extra effort.
How do you calculate maintenance supply costs per work order?
Add the cost of all parts and materials used on the work order, then divide by the number of work orders in the period if you want an average. For a single job, simply sum the extended cost of each line item (quantity used times unit cost). Include consumables like caulk, tape, and sealant even if they seem minor, because they add up quickly across hundreds of turns. This number feeds directly into your maintenance cost per work order KPI.
How can standardized maintenance kits help control supply costs?
Standardized kits group the exact parts needed for a common repair into one box, which reduces emergency store runs, cuts labor hours, and prevents over-ordering. Kits also simplify inventory: you track one SKU instead of dozens of individual parts, making reorder points and stock accuracy easier to manage.
Bathroom repairs are where maintenance budgets quietly bleed, one unlogged cartridge at a time. Ready Bathroom Solutions builds pre-kitted, OEM-grade repair sets that put every part for the job in one box, with 15 to 20 percent bundle savings and standardized components across your whole portfolio. Fewer store runs, fewer callbacks, faster unit turns. Get started with Ready Bathroom Solutions and bring your supply costs back under control.