

Table of Contents
- Preventative Maintenance Cost: The Real Math Property Managers Need
- Preventive vs. Reactive Maintenance: Where the Money Actually Goes
- Preventive Maintenance ROI: How to Calculate Break-Even by Asset
- Preventive Maintenance Disadvantages: When a Plan Costs More Than It Saves
- A Practical Decision Framework by Asset Type and Criticality
- Bathroom Maintenance Checklist: The Highest-ROI Items to Schedule First
- Measuring Results After You Adopt a Maintenance Plan
- Conclusion: Making the Call on Preventative Maintenance Cost
- Frequently Asked Questions
Last Updated: October 6, 2026
Preventative Maintenance Cost: The Real Math Property Managers Need
Is preventative maintenance worth the cost? For most property portfolios, yes, but only when the plan targets the right assets. This guide covers the real math, a cost-versus-repair calculator, a break-even framework by asset type, and the schedule that pays for itself first.
The core tension: preventative maintenance is not a blanket policy that saves money everywhere. It is a targeted investment.
Preventive vs. Reactive Maintenance: Where the Money Actually Goes
Reactive maintenance waits for equipment to fail, then repairs it. Preventive maintenance services equipment on a set schedule to prevent that failure.
The cost difference shows up in three places:
- Emergency repair premiums. Breakdowns happen at the worst time, and priority service calls cost more than scheduled visits.
- Collateral damage. A failed fill valve can flood a unit, damaging flooring and ceilings. A worn toilet seal can rot a subfloor.
- Downtime and disruptions. An out-of-service bathroom takes a unit or hotel room offline entirely.
Reactive work feels cheaper because the invoice is smaller and infrequent. It rarely is, the real expense is unplanned downtime, tenant impact, and rushed labor.
Preventive Maintenance ROI: How to Calculate Break-Even by Asset
Preventive maintenance ROI is the savings from avoided breakdowns, extended asset lifespan, and reduced emergency labor, measured against routine service cost. The break-even point is the failure rate at which scheduled maintenance becomes cheaper than reactive repair.
The formula is simple; the inputs are not. Most teams get the direction right and the magnitude wrong because they treat every asset as if it carries the same failure consequence.
The Break-Even Formula, Stated Plainly
For a single asset, break-even occurs when:
Annual service cost = (Failures per year) × (Cost per failure)
Rearranged, the break-even failure frequency is:
Break-even failures per year = Annual service cost ÷ Cost per failure
If the asset fails more often than that number, scheduled service wins; if less often, reactive repair is cheaper. The rest of this section is about getting the two inputs right.
Input 1: Annual Service Cost
This is labor hours plus parts, per asset, per year, not the invoice for one visit. It is the full recurring commitment: inspection time, replacement parts on a fixed interval, and the administrative overhead of scheduling and tracking the work.
Teams often undercount this input because they track parts but not labor. If a technician spends 20 minutes per fixture per year on inspection at a $45 loaded labor rate, that is roughly $15 per fixture per year before a single part is replaced, and across a portfolio, the service side stops looking free.
Input 2: Cost per Failure
This is where most calculations go wrong. Cost per failure is not the repair invoice, it is the invoice plus everything the failure drags along with it:
- Emergency labor premium. After-hours and priority calls typically bill at a higher rate than scheduled work.
- Collateral damage. A failed fill valve that runs overnight can damage flooring, ceilings, and cabinetry in the unit below.
- Downtime cost. An out-of-service unit or room carries lost rent or lost room revenue for every day it sits offline.
Downtime is the most consistently underestimated input, and usually the largest: a parts bill of a few dollars can sit next to a downtime cost orders of magnitude larger.
Break-Even by Asset Tier and Criticality
The break-even threshold is not the same for every asset. Segment by criticality before you run the math.
| Asset tier | Typical failure consequence | Break-even behavior |
|---|---|---|
| Critical, high-consequence | Unit or room offline, water damage, tenant displacement | Low break-even threshold; scheduled service usually wins |
| Critical, low-consequence | Nuisance failure, easy same-day fix | Moderate threshold; depends on failure frequency |
| Noncritical, low-value | Minor inconvenience, cheap part | High threshold; reactive repair often cheaper |
| Aging or out-of-warranty | Rising failure rate, parts scarcity | Threshold shifts toward replacement analysis, not service |
For critical, high-consequence assets, the break-even threshold is low because cost per failure is high, even a modest annual service cost is justified if it prevents one event.
The practical takeaway: run the break-even calculation per asset tier, not per portfolio. A blended average hides the assets that justify service and the ones that quietly drain budget.
A Transparent Cost-Versus-Repair Calculator for Your Portfolio
Build the calculator around four inputs. For each critical asset, list:
| Input | What to Enter | Why It Matters |
|---|---|---|
| Annual service cost | Labor hours + parts per year | Your baseline investment |
| Failure cost | Emergency labor + parts + downtime + collateral damage | The cost you're avoiding |
| Failure frequency | Failures per asset per year | The multiplier |
| Asset criticality | Tenant impact if it fails | Weighting factor |
Multiply failure frequency by failure cost for your annual reactive exposure, then compare it to annual service cost. The gap is your cost-benefit result, and for the five most critical assets, the answer is usually not close.
Sensitivity to Labor, Parts, and Downtime Assumptions
Small changes in assumptions swing the result hard, so run the calculator across a range rather than trusting a single-point estimate.
Fill Valve / Flush Valve - Fluidmaster Pro Series™ Adjustable Fill Valve →
- Labor rate. If the loaded labor rate rises, preventive work gets more expensive, but so does every emergency call, which typically bills at a premium. The relative advantage of scheduled service often widens.
- Parts availability and standardization. Standardized, bulk-purchased parts lower the preventive side; mixed or scarce components raise the reactive side because every emergency becomes a sourcing problem.
- Downtime cost. The most sensitive input. A single out-of-service unit carries real lost rent or room revenue that dwarfs the parts bill. Run the calculator with conservative and realistic downtime assumptions; the break-even point moves, but the direction rarely does.
Preventive Maintenance Disadvantages: When a Plan Costs More Than It Saves
Preventative maintenance disadvantages are real, and ignoring them wastes money. A plan costs more than it saves when:
- You service low-criticality assets on a fixed schedule. Replacing a part that is not near failure burns labor and parts for no return.
- You over-service. Inspecting and cleaning equipment more often than the manufacturer recommends adds cost without extending asset lifespan.
- You lack the labor to execute it. A plan that sits unworked is pure overhead.
The over-servicing risk is the one most guides skip. A maintenance schedule is a tool, not a virtue. If the data says an asset is reliable, leave it alone and spend the budget where failure risk is high.
A Practical Decision Framework by Asset Type and Criticality
Use this framework to decide where a maintenance plan earns its keep. Work through the inputs in order for each asset, score each one, and let the total point you toward scheduled service, reactive repair, or replacement.
The break-even math only tells you whether service is cheaper than failure, not whether the asset is worth servicing, whether the warranty covers the work, or whether replacement is the better spend.
The Six Inputs
Score each input low, medium, or high for the asset in front of you.
- Failure probability. How likely is this asset to fail in the next 12 months? High failure rate points toward preventive service; low points toward reactive repair.
- Consequence of failure. What happens if it fails? Flooding, tenant displacement, or room takedowns push hard toward preventive. A nuisance failure fixed in an hour does not.
- Service cost. What does scheduled service cost per year, all-in? High recurring cost raises the bar the asset has to clear.
How to Read the Score
The pattern is straightforward once the inputs are scored:
- High failure probability + high consequence + high downtime cost → schedule it. These assets have the lowest break-even threshold and the highest cost of getting it wrong.
- Low failure probability + low consequence + low downtime cost → leave it reactive. A fixed schedule here is over-servicing by definition.
- High service cost + aging asset + rising failure rate → evaluate replacement. At some point annual service cost approaches the cost of a new asset, and continuing to service throws money at a depreciating problem.
A Worked Example
A flush valve in a fully occupied unit is high-failure-probability, high-consequence, high-downtime, with modest service cost and an expired warranty.
A shutoff valve behind an access panel in a rarely used utility closet is the opposite: low failure probability, contained consequence, near-zero downtime cost, cheap fix.
Most bathroom fixtures fall into the first group because a single failure affects an entire unit or room.
Where the Framework Breaks Down
The framework assumes you have failure data. If you do not, the first 90 days should be measurement, not service: track callbacks by asset type and let the data populate the failure probability input before committing budget.
For the parts themselves, standardized components matter as much as the schedule. A pre-kitted repair set from Ready Bathroom Solutions consolidates the fill valves, flush valves, and toilet seals a job needs into one box, removing the store run and keeping repairs consistent across every unit.

Bathroom Maintenance Checklist: The Highest-ROI Items to Schedule First
Start with the fixtures that cause the most callbacks, the highest-ROI items on any bathroom maintenance checklist.
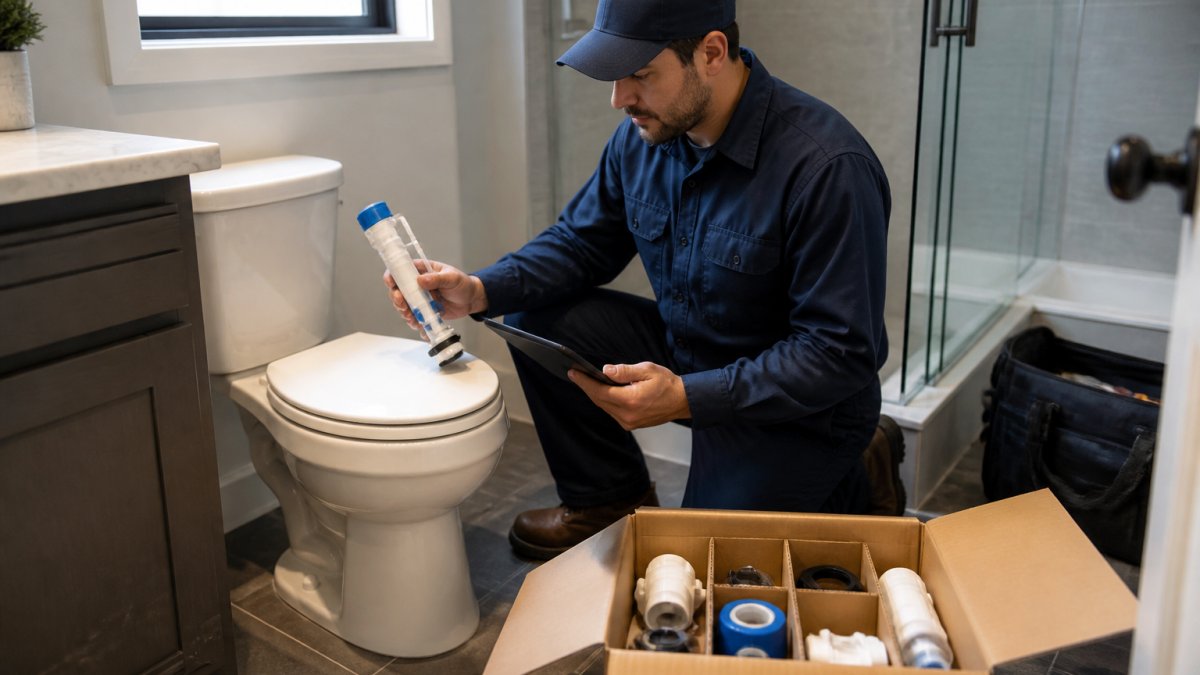
- Fill valves and flush valves. Inspect annually for slow refill, running water, or weak flush. A worn fill valve is a top cause of wasted water and tenant complaints.
- Toilet seals and wax rings. Check for leaks, odors, or movement at the base. A failing seal can damage the subfloor.
- Flappers and flush mechanisms. Test for a proper seal and consistent flush.
For the parts, we stock OEM-grade components from brands like Fluidmaster and PROFLO.

Measuring Results After You Adopt a Maintenance Plan
Track four numbers to know whether the plan is working. Callback rate per unit, average repair cost, emergency call volume, and unit turnaround time.
What most guides miss is that the first metric to move is rarely cost. It is callback rate.
If callbacks do not fall within two quarters, the plan is likely mis-targeted, not wrong in principle. Re-run the break-even calculator and shift service to higher-criticality assets.
Conclusion: Making the Call on Preventative Maintenance Cost
The question is not whether preventative maintenance works in general. It is whether it works on your specific assets. Run the break-even math, segment by criticality, and let the failure data decide.
For property teams that want the parts side handled, Ready Bathroom Solutions offers pre-kitted, OEM-grade bathroom repair sets with standardized components, 15-20% bundle savings, and an all-in-one box design that eliminates store runs and reduces callbacks.
Frequently Asked Questions
What are the disadvantages of preventive maintenance?
The main drawbacks are upfront labor and parts costs on assets that may not fail soon, over-servicing equipment that doesn't need it, and the risk of tying up budget in scheduled work while an urgent repair competes for the same crew. Older equipment nearing replacement can also make the preventative maintenance cost hard to justify. The fix is tiering your plan: put critical assets like toilets, fill valves, and water lines on a fixed schedule, and let lower-risk items run to failure.
How do you calculate the return on investment for preventative maintenance?
Add up your annual planned maintenance costs: labor hours, parts, and any service contracts. Then estimate what you avoid: emergency repair premiums, after-hours callouts, accelerated asset replacement, and revenue lost to unit or room downtime. Divide the avoided costs by the planned costs. A plan that costs $8,000 a year and prevents $20,000 in emergency repairs and downtime returns roughly 2.5x. Track your actual callback and downtime numbers for two quarters to validate the estimate.
Is preventative maintenance cheaper than reactive maintenance?
For high-use, high-consequence assets, usually yes. A $10.82 <a href="https://readybathroomsolutions.com/products/fill-valve-flush-valve-pro45">Fluidmaster Pro Series fill valve</a> replaced on a scheduled visit costs far less than the same failure handled as an after-hours emergency with water damage and a displaced tenant or guest. Reactive maintenance looks cheaper per incident because you only pay when something breaks, but the emergency labor rate, water cleanup, and lost room nights push the true cost well above a planned replacement.
How often should rental properties receive preventative maintenance?
Most multifamily and hospitality operators run a quarterly walkthrough for bathrooms and kitchens, with an annual deeper service on fixtures like toilets, faucets, and shut-off valves. High-turnover units may need a quick inspection at every turnover. Build your bathroom maintenance checklist around items that fail predictably, such as fill valves, flappers, seals, and caulk lines, and adjust frequency based on runtime and asset condition rather than a fixed calendar alone.