

Table of Contents
- Why Labor Costs Matter in Bathroom Repairs
- Understanding Your Current Labor Breakdown
- Step-by-Step: How to Calculate Labor Savings on Bathroom Repairs
- Reducing Unit Turn Time for Bathrooms
- Cost of Maintenance Callbacks and How to Avoid Them
- Using a Bathroom Maintenance Labor Cost Calculator
- Real-World Savings: Labor-to-Material Ratios
- Conclusion
Last Updated: August 28, 2026
Why Labor Costs Matter in Bathroom Repairs
Labor represents 50-70% of most bathroom repair project budgets (bls.gov). For property managers overseeing multiple units, this cost structure directly impacts profitability. The challenge isn't that labor is expensive, it's that most teams don't measure it accurately. Without visibility into actual repair hours, time waste, and repeat visits, you can't optimize what you don't track.
This guide from Ready Bathroom Solutions breaks down how to calculate labor savings on bathroom repairs systematically. Whether you manage apartments, hotels, or student housing, the methodology applies: document your current state, identify inefficiencies, measure improvement, and implement solutions that stick.
Understanding Your Current Labor Breakdown
Before you can save on labor, you need to know exactly how your current repairs consume time and money.
Hourly rates vs. total project labor
Your hourly labor rate is only half the picture. A technician earning $35 per hour isn't costing you $35 per hour when you factor in overhead, benefits, payroll taxes, and vehicle costs. That fully burdened wage rate typically runs 1.3 to 1.5 times the base hourly wage (bls.gov).
Total project labor includes travel time, parts gathering, setup and breakdown, waiting for inspections, and callbacks for incomplete work. A 30-minute repair requiring an hour of travel and parts-gathering actually costs two hours of labor. Multiplied across dozens of units monthly, this impact becomes massive.
Most property managers negotiate better hourly rates but ignore structural inefficiencies that add hours to every job.
Hidden labor costs in bathroom repairs
Bathroom repairs hide several labor cost categories that don't show up on simple invoices.
Maintenance callbacks occur when a repair fails or incompletely addresses the problem. A technician installs a new faucet but the rough-in valve was corroded, requiring a second visit. Callbacks typically add 10-15% to overall labor expense, though many teams never track this separately (peer-reviewed research).
Permit and inspection labor varies by jurisdiction and complexity. Scheduling coordination, waiting time, and potential rework if inspectors flag issues all consume labor that sits between your technician and the property owner.
Scheduling inefficiency happens when technicians make multiple trips to the same property because repairs weren't batched. Sending separate technicians for a toilet, shower valve, and sink leak wastes travel time and coordination overhead.
After-hours emergency calls carry premium labor costs. A Friday night leak means either overtime rates or escalated water damage costs.
Document these categories for a month. Most facilities teams discover that 20-30% of labor expense comes from these hidden costs, not core repair work.
Step-by-Step: How to Calculate Labor Savings on Bathroom Repairs
Step 1: Document your current repair timeline
Start with a single bathroom repair type, say, a toilet replacement. Track actual time from work order creation to completion.

Record:
- Time the technician receives the work order
- Time they depart to the property
- Time they arrive on-site
- Time they begin the actual repair
- Time the repair finishes
- Time they depart the property
- Time the work order closes
Do this for at least 10 repairs of the same type. Patterns emerge quickly. If toilet replacements average 2.5 hours from work order to completion but actual installation takes 30 minutes, you've found 2 hours of waste per job.
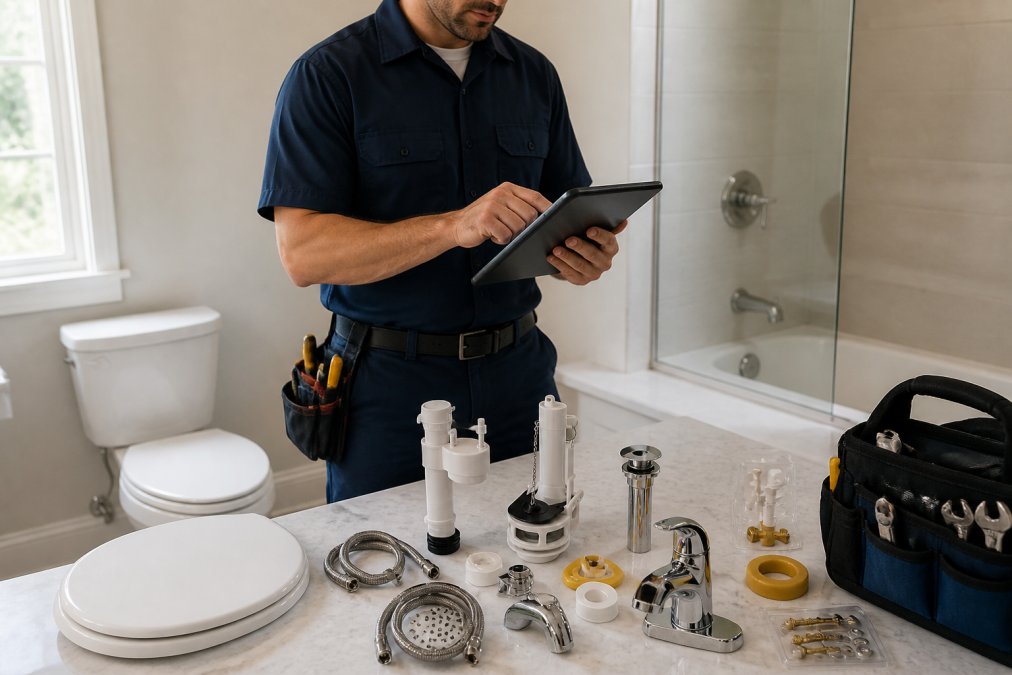
Step 2: Calculate total labor hours and costs
Multiply your average hours per repair by your fully burdened labor rate. If a toilet replacement takes 2.5 hours and your burdened rate is $52 per hour (base rate of $35 plus overhead), that repair costs $130 in labor.
Multiply by your monthly repair volume. If you do 40 toilet replacements monthly across your portfolio, that's $5,200 in monthly labor for this single repair type.
Break this down by labor category:
- Direct repair time: 0.5 hours × $52 = $26
- Travel and setup: 1.2 hours × $52 = $62
- Parts gathering and coordination: 0.8 hours × $52 = $42
- Total: $130 per repair
This breakdown reveals where time actually goes. In this example, the actual repair is only 20% of the labor cost. The other 80% is overhead and inefficiency.
Step 3: Identify time-wasting inefficiencies
Now that you've mapped where time goes, look for patterns in waste categories.
Are technicians making multiple trips to the same property because work orders aren't batched? That's a scheduling process problem.
Are they spending 45 minutes gathering parts from different suppliers because your kit inventory is incomplete? That's a supply chain problem.
Are callbacks happening because the technician lacked information about existing fixtures? That's a documentation problem.
Common inefficiencies include incomplete work order information, lack of standardized parts inventory, uncoordinated scheduling, inadequate tool access, and poor tenant communication.
For each inefficiency, estimate the time it adds. If incomplete work order information causes 15 minutes of delay per job, and you do 40 jobs monthly, that's 10 hours of wasted labor monthly.
Step 4: Estimate savings from process improvements
Once you've identified inefficiencies, calculate the labor savings from fixing them.
If standardizing your parts inventory eliminates parts-gathering time (0.8 hours per repair), and you do 40 toilet replacements monthly, you save 32 hours per month. At $52 per hour, that's $1,664 monthly savings on this single repair type.
If batching repairs at the same property reduces travel time by 0.4 hours per repair, that's another 16 hours monthly, or $832 in savings.
If better work order documentation eliminates 10 minutes of rework per repair, that's 6.7 hours monthly, or $348 in savings.
Total potential monthly savings from these three improvements: $2,844 for one repair type. Scale this across your full bathroom repair portfolio and you're looking at tens of thousands in annual labor savings.
Reducing Unit Turn Time for Bathrooms
Unit turn time, the hours between tenant checkout and the next tenant's move-in, is where labor savings directly hit your bottom line. Bathroom repairs are often the bottleneck.
A standard bathroom turn involves multiple tasks: toilet replacement, sink and faucet work, shower or tub fixture service, caulking, and sometimes rough-in modifications. Multiple technician visits extend vacancy time.
The labor-to-material ratio in bathroom turns typically runs 60-40 (60% labor, 40% materials). Reducing labor hours is the fastest way to reduce total turn time.
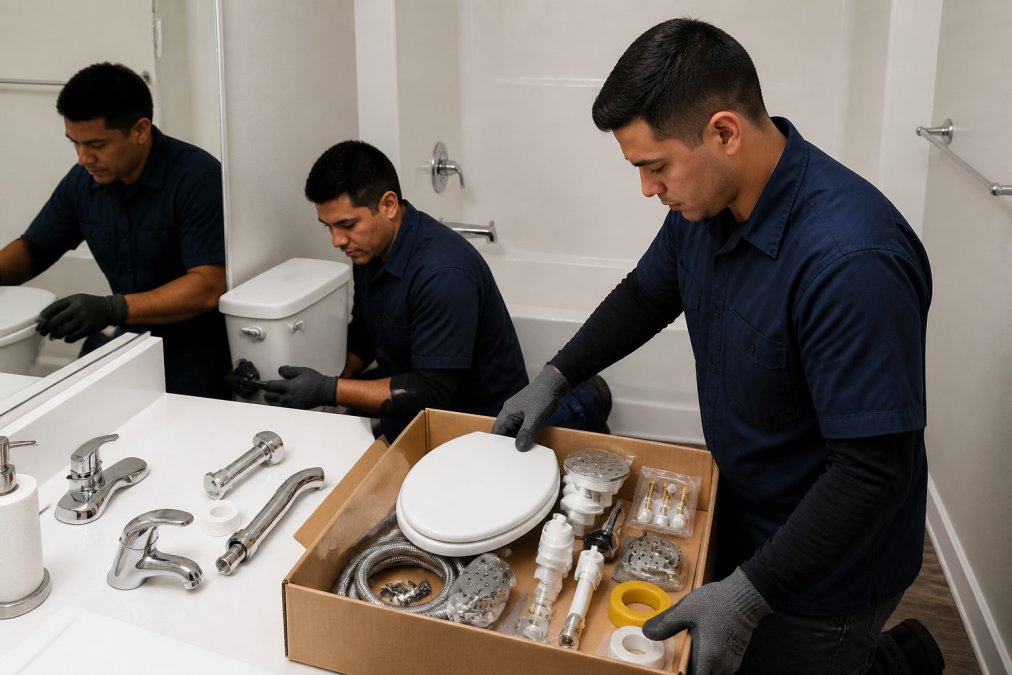
Pre-kitted repair solutions address the biggest time-waster: parts gathering. When all necessary components arrive in a single box with OEM-grade parts from manufacturers like Moen, Delta, and BrassCraft, your technician doesn't need supply runs. They arrive on-site with everything required.

This standardizes the repair process. Technicians work with consistent, high-quality components, reducing rework and callbacks. When your entire portfolio uses the same fixture brands and quality standards, technicians become more efficient.
Eliminating a 45-minute supply run per bathroom turn, across 20 bathroom turns monthly, saves 15 hours monthly. At a burdened labor rate of $52 per hour, that's $780 monthly savings, over $9,300 annually for a single property managing 20 bathroom turns monthly.
Ready Bathroom Solutions' pre-kitted approach delivers this efficiency by consolidating all necessary parts into a single order. Your technician completes the repair faster, and your unit returns to revenue-generating status sooner.
Cost of Maintenance Callbacks and How to Avoid Them
A callback is a second visit to complete or fix a repair that should have been finished the first time. In bathroom repairs, callbacks are expensive and common.
Callbacks happen due to incomplete work order information, incompatible replacement parts, poor quality initial work, or damage discovered during the repair. The direct cost is another full labor visit. If your first visit cost $130, the callback costs another $130. Indirect costs include tenant dissatisfaction, delayed unit turnover, emergency scheduling overhead, and potential water damage.
Callbacks are a symptom of process breakdown, not inevitability.
To reduce callbacks, focus on three areas:
First, standardize your parts and quality standards. When every unit has the same fixture brands and quality level, callbacks due to incompatible parts or premature failure drop dramatically. Using OEM-grade parts from established manufacturers like Moen and Delta reduces defective component risk.
Second, improve work order documentation. Include photos of existing fixtures, notes about previous issues, and specific tenant requests. This gives your technician the context needed to avoid surprises.
Third, implement a quality check before closing the work order. Have the technician verify that the repair meets your standards before marking it complete.
Reducing callbacks from 15% of repairs to 5% saves significant labor. If you currently have 100 bathroom repairs monthly with a 15% callback rate, that's 15 callbacks. Reducing to 5% means 5 callbacks. The 10 eliminated callbacks represent 10 full labor visits, or roughly 25 hours of labor monthly. At $52 per hour, that's $1,300 in monthly savings.
Using a Bathroom Maintenance Labor Cost Calculator
A labor cost calculator converts your repair data into actionable insights. At minimum, it should track repair type, scheduled vs. actual time, fully burdened labor rate, total labor cost per repair, labor cost per square foot, callbacks and rework hours, and monthly and annual totals.
You can build this in a spreadsheet or use property management software with labor tracking. Consistency is key: every repair gets logged the same way, every month.
Your calculator should answer these questions:
- What's my average labor cost per bathroom repair, by repair type?
- How much labor time am I spending on callbacks and rework?
- Which repair types are most labor-intensive?
- How does my labor cost per unit compare to industry benchmarks?
- What's the ROI on process improvements I've implemented?
Once you have historical data, you can set targets. If your current average toilet replacement costs $130 in labor and identified inefficiencies could reduce it to $100, you have a specific goal.
The calculator also helps you evaluate whether pre-kitted solutions make financial sense. If a pre-kitted bathroom repair box costs more upfront but saves 45 minutes per repair and eliminates one callback per ten repairs, the math becomes clear. The kit pays for itself in labor savings within months.
Real-World Savings: Labor-to-Material Ratios
The labor-to-material ratio shows how much of your bathroom repair budget goes to labor versus parts. This ratio varies by repair type and project scope.
A simple faucet replacement might run 70% labor, 30% materials. A full bathroom renovation might run 50% labor, 50% materials.
For most bathroom repairs in property maintenance, labor typically represents 60-65% of total project cost. This means labor savings are your highest-impact lever.
When you implement efficiency improvements, standardized parts, pre-kitted solutions, and better scheduling, you directly improve this ratio. Reducing labor from 65% to 55% of project cost through process improvements cuts labor spending by 15% while maintaining quality.
Ready Bathroom Solutions' pre-kitted approach directly improves this ratio by reducing labor hours required per repair. Because all parts arrive together and are standardized across your portfolio, technicians work faster and more reliably. The material cost per kit might be slightly higher than sourcing parts individually, but labor savings offset the difference.
Bundle savings (15-20%) come from consolidated ordering and standardized inventory management, not cheaper parts. You're paying for convenience and efficiency, which translates directly to labor hour reduction.
Calculating labor savings on bathroom repairs starts with measuring what you're currently spending. Most property teams operate on estimates and assumptions, not actual data. Once you track real repair times, identify where hours disappear, and quantify inefficiencies, improvement becomes possible.
The opportunity in bathroom repairs is substantial. A property managing 20 bathroom turns monthly can easily save $10,000-15,000 annually by eliminating supply runs, standardizing parts, and reducing callbacks. For a portfolio with multiple properties, that number scales significantly.
Ready Bathroom Solutions addresses the biggest labor-waster in bathroom repairs: the time technicians spend gathering parts from multiple suppliers. Pre-kitted repair boxes arrive complete with OEM-grade components, eliminating supply runs and reducing repair time by 30-45 minutes per job. For property teams managing multiple units, this translates to measurable labor cost reduction and faster unit turns. Shop All Bathroom Kits to see how standardized, pre-kitted solutions can simplify your bathroom repair process and improve your labor-to-material ratio across your entire portfolio.
Frequently Asked Questions
Q: What percentage of a bathroom repair project is typically labor?
A: Labor typically accounts for 40-60% of total bathroom repair costs, depending on project scope and complexity. Simple fixture replacements skew higher toward labor (50-60%), while extensive renovations with material-heavy work average around 40-50%. Your actual percentage depends on hourly rates in your region, the skill level required, and whether you're handling callbacks or emergency repairs, which carry premium labor charges.
Q: How do you calculate labor savings on bathroom repairs?
A: Start by tracking your current repair time from job start to completion, including travel and material shopping. Multiply total hours by your average hourly labor rate (including burdened wages and overhead). Then identify inefficiencies: store runs, part delays, or rework. Estimate time saved through pre-kitted solutions or process changes, multiply by hourly rate, and subtract implementation costs. The difference is your potential labor savings on bathroom repairs.
Q: What hidden costs should I factor into bathroom maintenance labor?
A: Hidden labor costs include contractor travel time, store runs for missing parts, wait time for material delivery, project management overhead, permit and inspection coordination, and callback labor for incomplete first-visit repairs. These can add 15-30% to your baseline labor estimate. Pre-kitted repair solutions eliminate store-run delays and reduce callbacks, directly lowering these hidden costs and improving your labor-to-material ratio.
Q: How can I reduce the cost of maintenance callbacks?
A: Callbacks spike when repairs are incomplete, parts are wrong, or installations fail prematurely. Use OEM-grade components from trusted brands, ensure first-visit completeness by bundling all necessary parts, and standardize repair procedures across your portfolio. Pre-kitted solutions like Ready Bathroom Solutions eliminate guesswork and missing parts, reducing callback rates and freeing labor hours for new repairs instead of rework.
This article was written using GrandRanker